The official newsletter of the Thematic Network for Ultraviolet Measurements
Contents
Co-ordinators column *
Report on the Third Workshop *
Extended Abstracts *
The Fourth Workshop in Borås, September 6 - 8, 2000 *
Report on the First Training Course on Ultraviolet Measurement *
The Second Training Course on Ultraviolet Measurement *
Evaluation of the Network *
Working Groups *
News-Flash *
Service Card *
ISSN 1456-2537
Picaset OY, Helsinki 2000
The Thematic Network for UV measurements has generated many activities during the past two years, such as a series of workshops, training courses, working groups, UVNEWS etc. As decided at the previous workshop in Teddington, the fourth workshop will be arranged in September 6-8, 2000 in Borås, Sweden (for more information see page * of this issue). The coming workshop will be an interesting focal point for many of the activities related to the Thematic Network: The working group documents will be finalised at the workshop and two research projects will describe their results there. The EU funded project "Improving the Accuracy of Ultraviolet Radiation Measurements" has been linked with the Thematic Network for dissemination of the results of the project and for feedback from the EU ultraviolet radiation measurements community. In addition, the EUROMET project "Evaluation of the Radiometric Performance of UV Photodetectors," including participants also outside the Europe, will present their results in the fourth Thematic Network workshop.
The second training course of the Thematic Network will be arranged in the beginning of May in Innsbruck, Austria (for more information see page *). The course will be a unique opportunity for new people in the ultraviolet radiation measurements to acquire the basic information and get acquainted with the best experts in the field. There are only few weeks to the registration deadline, so it would be preferable that all national Network contact persons and others rapidly distribute information on the coming training course.
Evaluation of the activities of the Thematic Network was made in connection with the previous workshop and training course (see page *). As judged by the returned evaluation forms, the participants considered the activities of the Thematic Network important and would appreciate continuation of the activities. Looking at the various activities, the present working group tasks need to be completed by the end of the EU funded part of the Thematic Network, but the working groups could continue with new objectives, if they consider it important. It has been suggested by the training course co-ordinator, NPL, that they might continue the training courses on a commercial basis after year 2000. In any case, HUT will continue to maintain the Thematic Network web pages (http://metrology.hut.fi/uvnet/) including the recently initiated action spectrum database. Thus the remaining main question to be discussed in the Borås workshop will be the time and place of the possible fifth workshop.
Erkki Ikonen
Co-ordinator of the Thematic Network
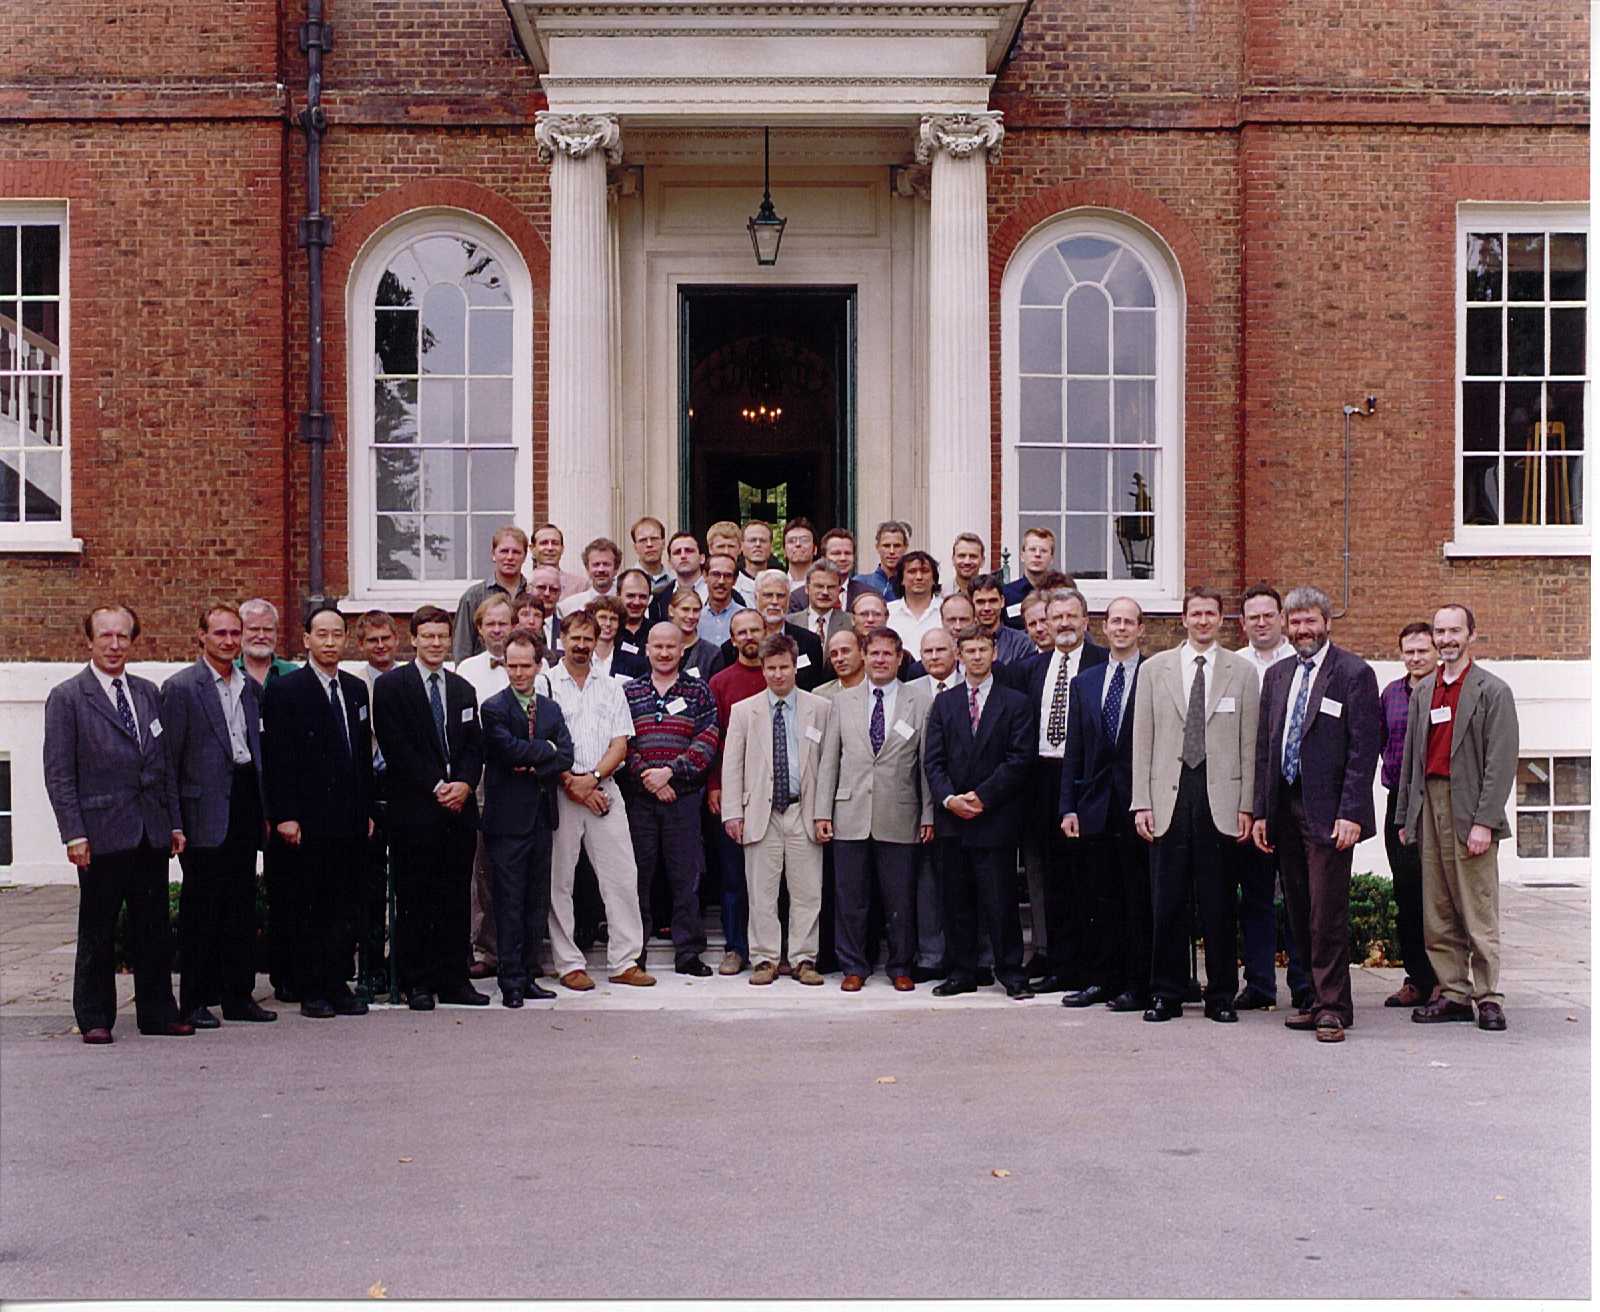
The Thematic Network for Ultraviolet Measurements arranged its third workshop in Teddington, UK, on September 8-10, 1999. On the first day, excursions to various laboratories of NPL were arranged. The last two days were dedicated for working group meetings and scientific presentations. The number of participants of the workshop was 51.
6 oral presentations were given in the workshop. The topics were selected by the steering group from a list of topics of interest that had been collected based on the feedback of earlier Workshops. In addition, 11 posters were presented. The titles and authors of the oral presentations are listed below.
1. Uncertainty and confidence in measurements (John Hurll)
2. Measurement of actinic radiation (Prof. Dr.-Ing. Wolfgang Heering)
3. High power UV-lasers and UV-measurement techniques for excimer lasers (157 nm - 351 nm) - state of the art and future developments (Dr. Michael Fiebig)
4. UV measurements in artificial weathering of polymeric materials (Prof. Bo Carlsson)
5. Integral UV-Meters - Physical principles - States of the art - Problems of applications (Anton Gugg-Helminger)
6. International Ultraviolet Association (Dr. Petra Rettberg)
In contrast to earlier workshops, much more time was allocated to working group meetings. This seemed very useful. All working groups made remarkable progress towards achieving their set objectives.
One of the major decisions of the workshop was the establishment of a database for UV action spectra. The collection of the data has already begun, and the results achieved so far may be reviewed in the web pages of the network (http://metrology.hut.fi/uvnet/). All readers who have in their possession action spectra missing from the database are encouraged to submit their data to Petri Kärhä (petri.karha@hut.fi).
In the arrangements of the workshop, NPL showed once again their talent in arranging big events. Everything worked extremely smoothly for which we all participants owe a big Thank-You for Bill Hartree and all other staff members in charge of the arrangements.
Of the authors of the scientific presentation, two used their opportunity to submit an extended abstract to UVNEWS. These articles may be seen in the following section.
Uncertainty and Confidence in Measurements
John Hurll
UKAS, Feltham, UK
0. Introduction
All measurements are tainted by imperfectly known errors, so the significance associated with the result of a measurement must account for this uncertainty. This paper explores the reasoning behind, and the requirements for, the expression of a value of uncertainty associated with a measurement result.
1. Requirements for measurement uncertainty
It is a requirement for all accredited calibration laboratories that results reported in a calibration certificate are accompanied by a statement describing the uncertainty associated with those results. It is also a requirement for test laboratories, under the following conditions:
Accredited laboratories are required to have a defined policy covering the provision of estimates of the uncertainties of the calibrations or tests performed. The laboratory should use documented procedures for the estimation, treatment and reporting of the uncertainty.
Laboratories should consult their accreditation body for any specific guidance that may be available for the calibration or testing field concerned.
The means by which accredited laboratories are expected to treat measurement uncertainties are defined in detail in the ISO Guide [1]. The UKAS document M 3003 [2] has been derived from this Guide and is in general use in all accredited calibration laboratories.
2. General principles
The objective of a measurement is to determine the value of the measurand, i.e. the specific quantity subject to measurement. For calibration laboratories this could be any measurement parameter within the recognised fields of measurement - length, mass, time, pressure, electric current etc. When applied to testing, the general term measurand may cover many different quantities, e.g. the strength of a material, the level of emissions of noise or electromagnetic radiation, the quantity of micro-organisms. A measurement begins with an appropriate specification of the measurand, the generic method of measurement and the specific detailed measurement procedure.
No measurement is perfect and the imperfections give rise to error of measurement in the result. Consequently, the result of a measurement is only an approximation to the value of the measurand and is only complete when accompanied by a statement of the uncertainty of that approximation. Indeed, because of measurement uncertainty, "true value" can never be known. In the limit, because of quantum effects, it may not even exist!
It should also be noted that the indefinite article "a", rather than the definite article "the", should be used in conjunction with "true value" because there may be more than one value consistent with the definition of a particular quantity.
Uncertainty of measurement comprises, in general, many components. Some may be evaluated from the statistical distribution of the results of a series of measurements and can be characterised by experimental standard deviations. The other components, which can also be characterised by standard deviations, are evaluated from assumed probability distributions based on experience or other information.
Random errors arise from random variations of the observations. Every time a measurement is taken under the same conditions, random effects from various sources affect the measured value. A series of measurements produces a scatter around a mean value. A number of sources may contribute to variability each time a measurement is taken, and their influence may be continually changing. They cannot be eliminated but the uncertainty due to their effect may be reduced by increasing the number of observations and applying statistical analysis.
Systematic errors arise from systematic effects, i.e. an effect on a measurement result of a quantity that is not included in the specification of the measurand but influences the result. These remain unchanged when a measurement is repeated under the same conditions and therefore will not be revealed by repeated measurements. Their effect is to introduce a displacement between the value of the measurand and the experimentally-determined mean value. They cannot be eliminated but may be reduced, for example by making corrections for the known extent of an error due to a recognised systematic effect.
The total uncertainty of a measurement is a combination of a number of component uncertainties. Even a single instrument reading may be influenced by several factors. Careful consideration of each measurement involved in the calibration or test is required to identify and list all the factors that contribute to the overall uncertainty. This is a very important step and requires a good understanding of the measuring equipment, the principles and practice of the calibration or test and the influence of environment.
The next step is to quantify component uncertainties by appropriate means. An initial approximate quantification may be valuable in enabling some components to be shown to be negligible and not worthy of more rigorous evaluation. In most cases, a practical definition of negligible would be a component that is not more than a fifth of the magnitude of the largest component. Some components may be quantified by calculation of the standard deviation from a set of repeated measurements (Type A) as detailed in M 3003. Quantification of others will require the exercise of judgement, using all relevant information on the possible variability of each factor (Type B). For ‘Type B’ estimations, the pool of information may include some or all of those factors listed in Section 3.
Subsequent calculations will be made simpler if, wherever possible, all components are expressed in the same way, e.g. either as a proportion (percent, parts per million) or in the same units as used for the reported result.
3. Sources of uncertainty
There are many possible sources of uncertainty. As these will depend on the technical discipline involved, it is not possible to give detailed guidance here. However the following general points will apply to many areas of calibration and testing:
These sources are not necessarily independent and, in addition, unrecognised systematic effects may exist that cannot be taken into account but contribute to error. It is for this reason that accreditation bodies encourage - and sometimes insist on - participation in inter-laboratory comparisons, measurement audits and internal cross-checking of results by different means.
Further information regarding sources of uncertainty is given in M 3003 Edition 1 [2]:
Electrical calibrations: Appendix D
Mass calibrations: Appendix E
Temperature calibrations: Appendix F
Dimensional calibrations: Appendix G
4. Combination of uncertainties
Once the uncertainty contributions associated with a measurement process have been identified and quantified it is necessary to combine them in some manner in order to provide a single value of uncertainty that can be associated with the measurement result.
It should be stated at this point that there is no "correct" way of combining uncertainties. The ISO Guide to the Expression of Uncertainty in Measurement [1] is the accepted method for most laboratories and accreditation bodies, but it should be remembered that it is a guide - a set of conventions, designed to produce a reasonably quantifiable uncertainty statement, based on established statistical techniques. We are trying to express the concept of impreciseness as precisely as possible!
By using a predetermined set of conventions, such as is presented in the Guide, accreditation bodies, laboratories and their clients are able to compare results from different sources in a meaningful manner. This approach also means that uncertainties, passed down from National Standards to the end user (often through a chain of several laboratories) are treated in a consistent and meaningful manner at each step of this process.
5. Arithmetic summation
An easy and obvious way of combining uncertainty contributions is simply to add them up and quote the total as the overall uncertainty. This method has the advantages that it is quick, easy and generally yields a high level of confidence. In fact, at first sight, the use of arithmetic summation would imply 100 % confidence in the extent of the uncertainty associated with the measurement result.
Arithmetic summation does, however, have disadvantages. First, it is unlikely that, when errors from a number of different sources are combined, the sign and magnitude of the errors are such that they will all add up to the limit value produced by arithmetic summation. Arithmetic summation means, therefore, that an unduly pessimistic value of uncertainty would often be quoted.
Secondly, every experienced metrologist knows that if a measurement is repeated a number of times under the same conditions, a spread of values will be obtained. Furthermore, there will occasionally be a result that is so inconsistent with the others that the metrologist will ignore it, regarding it as an outlier or spurious result. But how far away does this outlier have to be from the mean value before it is ignored? This is where the experience of the metrologist comes in - he or she will, through knowledge and experience, have developed an almost intuitive "feel" for results that should be discounted. So, almost without thinking about it, the metrologist is imposing statistical limits on the spread of values that are included in the overall uncertainty - and without any quantifiable justification for the extent of these limits.
It follows that if this intuitively truncated spread of values is added in with other sources of error, there is a small but finite possibility that the "true value" actually lies outside the stated uncertainties - in other words, the 100 % confidence implied by arithmetic summation is not attainable. Using this approach, a statement of the confidence with which it is assumed that the "true value" does lie within the stated limits is not possible.
6. Statistical approach to uncertainty
For the reasons explored above, the Guide [1] approaches the subject of measurement uncertainty using statistical methods. As with all methods of addressing this subject it is not perfect - it sometimes depends, for example, on imperfectly known probability distributions being assumed to have particular characteristics - but it enables reasonable values to be assigned to the overall uncertainty, complete with information regarding the confidence probability with which the uncertainty statement is associated.
It is now apparent that the subject of measurement uncertainty is complex. The Guide, and its derivatives (such as M 3003 [2]) take a logical approach to the subject which will be examined next.
The Guide has adopted the approach of grouping uncertainty components into two categories based on their method of evaluation, ‘Type A’ and ‘Type B’. This categorisation of the methods of evaluation, rather than of the components themselves, avoids certain ambiguities. For example, a ‘random’ component of uncertainty in one measurement may become a ‘systematic’ component in another measurement that has as its input the result of the first measurement. Thus the overall uncertainty quoted on a certificate of calibration of an instrument will include the component due to random effects, but when this overall value is subsequently used as the contribution in the evaluation of the uncertainty in a test using that instrument, the contribution would be regarded as systematic.
Type A evaluation is done by calculation from a series of repeated observations, using statistical methods.
Type B evaluation is done by means other than that used for ‘Type A’. For example, by judgement based on:
Individual uncertainties are evaluated by the appropriate method and each is expressed as a standard deviation and is referred to as a standard uncertainty.
The individual standard uncertainties are combined to produce an overall value of uncertainty, known as the combined standard uncertainty.
An expanded uncertainty is usually required to meet the needs of most applications, especially where safety is concerned. It is intended to provide a greater interval about the result of a measurement than the standard uncertainty with, consequently, a higher probability that it encompasses the conventional true value of the measurand. It is obtained by multiplying the combined standard uncertainty by a coverage factor, k. The choice of factor is based on the level of confidence required.
The overall process used in the Guide and M 3003 can now be examined in more detail. There is an input quantity to the measurement process, for example the imported uncertainty. This input quantity is given the symbol x. There will usually be more than one input quantity and these can be represented by using the symbol xi.
The standard uncertainty associated with each input quantity is represented by u(xi). The standard uncertainty is defined as one standard deviation and is derived from the uncertainty of the input quantity by dividing by a number associated with the assumed probability distribution. The divisors for commonly encountered distributions are as follows:
Normal 1
Normal (k = 2) 2
Rectangular
Triangular
Ö 6U-shaped
Ö 2There is an output quantity for the measurement process - the estimated value of the measurand - and this is given the symbol y.
In some cases the input quantity to the process may not be in the same units as the output quantity. For example, one contribution to a measurement of, say, a gauge block or a Weston cell, may be the effect of temperature. In these cases the input quantity is temperature, but the output quantity is dimensional or electrical. It is therefore necessary to introduce a sensitivity coefficient so that the output quantity (y), can be related to the input quantity (xi). This sensitivity coefficient is referred to as ci.
The relationship between the input quantity and the output quantity may not be linear. In theory, the partial derivative, ![]()
u(xi) ci y
0,5
Note that, in this case, the sign of the temperature coefficient is ignored as the uncertainties will be expressed bilaterally, i.e. in ± form. This may not always be the case - sometimes the upper and lower uncertainty limits may be different and in such cases the sign of ci will have to be accounted for (see Section 7).
It may be that the sensitivity coefficient relating to a particular input/output quantity is unknown (the figure for the Weston cell example is based on long-established data). If this is the case, it may be derived experimentally. For example, if one of the input quantities is changed by a known amount while the others remain constant, the change in the output quantity can be measured and used to obtain the sensitivity coefficient for that particular input quantity.
Once the output quantities associated with each input quantity xi have been obtained in the form of a standard uncertainty (one standard deviation) they are combined by taking the square root of the sum of the squares. This yields the combined standard uncertainty uc(y).
The combined standard uncertainty, uc(y), is then multiplied by a coverage factor, k, to provide an expanded uncertainty, U. For most purposes a value of 2 is used for k, yielding a confidence level of approximately 95%.
The result of the measurement is then reported in the form y ± U. This statement is not complete without mention of the coverage factor used to obtain the expanded uncertainty. An indication of the confidence level obtained should also be included. The following statement is required by M 3003 to provide completeness of the information associated with a stated measurement uncertainty:
"The reported expanded uncertainty is based on a standard uncertainty multiplied by a coverage factor k = 2, providing a level of confidence of approximately 95 %. The uncertainty evaluation has been carried out in accordance with UKAS requirements."
The values for k and for the confidence level can, of course, be modified if different ones have been used.
7. Exceptions
There are some exceptions to the general guidance for the statistical method of combining uncertainties described in Section 6 of this paper. These can be summarised as follows:
These exceptions will now be examined in turn.
7.1 Unreliable input quantities
In cases where there is a high type A (random) contribution to the uncertainty budget the expanded uncertainty may be an under-estimate, particularly if not many repeat measurements have been made. In such cases the usual coverage factor k should be replaced by a modified coverage factor, kp, in order to provide the required confidence probability p. As a general guide, it will not be necessary to use a modified coverage factor if:
A step-by-step procedure for the calculation of kp, and a worked example, are presented in Appendix B of M 3003 [2]. If it is found necessary to use this procedure the statement given in Section 6 should be replaced by
"The reported expanded uncertainty is based on a standard uncertainty multiplied by the coverage factor k = XX, which for a t-distribution with
7.2 Dominant type B contribution
If there is a dominant systematic (type B) uncertainty contribution then it is possible that the expanded uncertainty calculated using the methods described in Section 6 could be greater than if the individual contributions had been added arithmetically.
To take an extreme example, suppose that there was only one uncertainty contribution and it was assumed to have a rectangular distribution. If this were treated as in Section 6 it would be divided by
Ö 3 (1.73) and then multiplied by k = 2 - and hence would end up larger than it started! The same logic can be applied to other distributions, such as U-shaped ones, where the divisor is less than the value of the coverage factor k.A practical approach to this problem is to extract the dominant contribution, ad, and add it arithmetically to the remaining contributions which can be calculated as previously described, i.e. U = ad + U’ where U’ is calculated from the remaining contributions as described in Section 6.
The difficulty with this arises when attempting to assign a coverage factor, or associated confidence level, when uncertainties have been combined in this manner. The probability involves the convolution of probability distributions and the manner in which this is done is outside the scope of this paper.
However, if this situation has arisen, it is probable that the distribution associated with the expanded uncertainty will be little different to that of the dominant contribution ad.
In such circumstances the statement of confidence presented in Section 6 could be replaced by a modified version such as:
"The uncertainty quoted is dominated by the uncertainty due to [uncertainty source] for which a rectangular [or otherwise] probability has been assumed".
7.3 Correlation
For the statistical approach to the combination of individual uncertainty contributions to be valid, there must be no common factors associated with these contributions. The input quantities must be independent of each other.
The effect of correlated input quantities may be to increase or decrease the combined standard uncertainty. For example, if the area of a rectangle is determined by measurement of it’s width and height using the same measuring implement the correlation will increase the uncertainty. On the other hand, if a gauge block were to be measured by comparison with another of identical material, the effect of uncertainty due to temperature will depend on the difference in temperature between the two blockes, and will therefore tend to cancel.
If the correlation is such that the combined standard uncertainty will be increased, as in the area measurement described in Section 7, the most straightforward approach is to add the standard uncertainties for these quantities before combining the result statistically with other contributions, as described in Section 6.
If, however, the correlation is such that the combined standard uncertainty will be decreased, as in the gauge block comparison above, the difference in standard uncertainty would be used as the input quantity.
A detailed approach to the treatment of correlated input quantities can be found in the Guide.
7.4 Asymmetrical uncertainty limits
There may be some cases where the positive and negative uncertainty limits may be different. This may arise due to the nature of the measurement - for example, cosine errors may arise in dimensional measurements due to misalignment of the measuring instrument; such errors are not symmetrical.
This effect can also arise due to the units in which the measurements, and the associated uncertainties, are expressed. For example, measurements of voltage reflection coefficient in RF and microwave electrical calibration are sometimes expressed in logarithmic units, i.e. decibels. However it transpires that if the device under test is very close to the reference value the negative limit, when expressed logarithmically, could be quite small (say, -1dB) but the positive limit could approach infinity. Such anomalies are best avoided by using linear terms wherever possible.
If the asymmetry between the positive and negative limits is small, then a practical approach is to calculate the combined standard uncertainty for the larger of the two limits and to quote the corresponding expanded uncertainty as a ± value. If, however, there is significant difference between them, the positive and negative limits should be calculated, and expressed, individually. Each can be treated as described in Section 6, with due regard being paid to the effects of dominant contributions and correlation. In these circumstances the sign associated with ci must be accounted for properly (see Section 6).
8. Example uncertainty budget - UV measurement
This example is presented to illustrate the principles involved in producing an uncertainty budget. The values used in this example are indended to be realistic. However, users of calibration systems should always determine their own uncertainty budgets based on the methods in use and the particular uncertainties associated with this method.
This example describes the calibration of an ultra-violet power meter. The power meter being calibrated is compared with a standard sensor. The light source is a UV lamp with a monochromator, containing a diffraction grating so that only the wavelength of interest, 365 nm, is transmitted. The calibration device and the standard sensor are moved alternately in and out of the beam emerging from the monochromator. The output from the standard sensor is processed in an amplifier and the resulting voltage is displayed on a digital multimeter. The corresponding UV power is then compared with the power level displayed on the calibration device.
The uncertainties in the system have been evaluated as follows:
The uncertainty budget is shown in Table 1.
Table 1. Uncertainty budget.
|
Symbol |
Source of uncertainty |
value ± |
Probability distribution |
Divisor |
ci |
ui (y)± % |
vi or veff |
|
DC |
Calibration of reference detector |
2,0 % |
Normal |
2 |
1 |
1,0 |
inf |
|
DD |
Drift of reference detector |
3,0 % |
Rectangular |
1,73 |
1 |
1,73 |
inf |
|
UB |
Effects of beam uniformity |
3,5 % |
Rectangular |
1,73 |
1 |
2,0 |
inf |
|
DS |
Effects of distance from source |
1,0 mm |
Rectangular |
1,73 |
0,4 % /mm |
0,23 |
inf |
|
RT |
Rounding errors due to resolution of test detector |
3,0 % |
Rectangular |
1,73 |
1 |
1,73 |
inf |
|
UREP |
Repeatability (5 readings) |
1,0 % |
Normal |
1 |
1 |
1,0 |
4 |
|
VC |
Voltmeter calibration |
0,02 % |
Normal |
2 |
1 |
0,01 |
inf |
|
VD |
Voltmeter drift |
0,1 % |
Rectangular |
1,73 |
1 |
0,06 |
inf |
|
AC |
Amplifier calibration |
0,05 % |
Normal |
2 |
1 |
0,025 |
inf |
|
AD |
Amplifier drift |
0,1 % |
Rectangular |
1,73 |
1 |
0,06 |
inf |
|
uc(y) |
Combined uncertainty |
|
normal |
|
|
3,47 |
>500 |
|
U |
Expanded uncertainty |
|
normal (k=2) |
|
|
6,94 |
>500 |
REFERENCES
[1] Guide to the Expression of Uncertainty in Measurement, BIPM, IEC, IFCC, ISO, IUPAC, OIML. International Organisation for Standardization, Geneva, Switzerland, First Edition, 1993.
[2] The Expression of Uncertainty and Confidence in Measurements. United Kingdom Accreditation Service, 21-47 High Street, Feltham, Middlesex TW13 4UN, UK. M 3003, Edition 1, 1997.
[3] International vocabulary of basic and general terms in metrology (VIM), BIPM, IEC, IFCC, ISO, IUPAC, OIML. International Organisation for Standardization, Geneva, Switzerland, First Edition, 1993.
APPENDIX: Definitions of terms
Coverage factor
: A number that, when multiplied by the combined standard uncertainty, produces an interval (the expanded uncertainty) about the measurement result that may be expected to encompass a large, specified fraction (e.g. 95 %) of the distribution of values that could be reasonably attributed to the measurand.Conventional true value (of a quantity): Value attributed to a particular quantity and accepted, sometimes by convention, as having an uncertainty appropriate for a given purpose
Error of measurement: The result of a measurement minus a true value of the measurand (not precisely quantifiable because true value lies somewhere unknown within the range of uncertainty).
Level of confidence: The probability that the value of the measurand lies within the quoted range of uncertainty.
Measurand: The specific quantity subject to measurement.
Standard deviation: The positive square root of the variance.
Uncertainty: A parameter, associated with the result of a measurement, which characterises the dispersion of the values that could reasonably be attributed to the measurand. (See Note below).
Standard uncertainty: The estimated standard deviation.
Combined standard uncertainty: The result of the combination of standard uncertainty components.
Expanded uncertainty: Obtained by multiplying the combined standard uncertainty by a coverage factor.
NOTE
There are problems associated with this definition of uncertainty of measurement, which is taken from the ISO Vocabulary of Metrology. What is the "dispersion" from if the true value cannot be known? It also implies that "uncertainty" is only relevant if several measurements are made, and it fails - by not mentioning "true value" - to invoke the concept of traceability. A more practical definition is as follows and is often used because it more exactly meets the needs of metrological accreditation services and industrial metrologists:
Uncertainty of measurement: Result of the evaluation aimed at characterising the range within which the true value of a measurand is estimated to lie, generally with a given confidence
This definition is not inconsistent with that given previously. It is taken from the National Foreword to the UK version of the International vocabulary of basic and general terms in metrology (PD 6461:Part 1:1995, published by the British Standards Institution).
Integral UV-Meters - Physical Principles - States of the Art - Problems of Applications
Anton Gugg-Helminger and Tran Quoc Khanh
Gigahertz Optik GmbH, Puchheim-Munich, Germany
1. Physical principles
Generally, the UV-actinic (photobiologically and photochemically effective) irradiance and radiance can be determined according to
![]() , (1)
, (1)
for actinic radiance [W m-2 sr-1], and
![]() , (2)
, (2)
for actinic irradiance [W m-2]. In Eqs. (1) and (2), Lel (l ) and Eel (l ) are the spectral radiance and spectral irradiance of the radiation source, respectively.
An integral radiometer head is an optical system, whose relative spectral responsivity is generally matched to an actinic function responsible for a certain photobiological / chemical effect.
Generally, an integral UV-meter consists of:
1.1. Input optics
It can be, for irradiance measurement:
An integrating sphere or diffuse reflector and fibre bundle sphere arrangement are not as common as the transmitting diffuser, which are mostly used today.
Input optics for the radiance measurements are imaging systems consisting of mirrors or quartz lenses focusing the objects to be measured onto a detector.
1.2. Filtering systems
There are some different configurations based on optical filters, biofilm, Polysulphone film badges and luminescence.
The biofilms and the polysulphone films have a spectral responsivity typically for certain biological and chemical processes and objects. They are often used for the determination of the erythema-effective dose or dose of similar weighted functions, depending on the spores used. The luminescence effects are utilised for conversions of the incoming UV-radiation into the visible radiation, which is then evaluated by a detector. The spectral filtering efficiency depends on the type of the luminescence layer. This principle is used for the so-called Robertson-Berger meter.
Optical filters such as glass filters and thin-layer filters (interference filters) have, from the point of now, the greatest application variations. For various measuring tasks with different action spectra, the variation of the optical characteristics can be reached by the choice of the filter sorts, the filter thickness, the variation of the edge wavelength for the interference filters, and possibly the variation of the incident angles on the interference layer. Additionally, by the use of the filtering methods, such as full filtering or partial filtering, the number of variation parameters can be enormously increased. By a correct solution of the filtering topics, which necessitates fundamental mathematical and physical knowledge during the development, a very good UV-radiometer can be manufactured and adapted to new generated weighting functions in a short time.
1.3. Detector systems
Various detector systems, including PMT’s, photo cells, semiconductor detectors and biological-chemical detectors, can be used.
Twenty years ago, there were some developments with PMT’s for realising the erythema meters. Generally, PMT’s have the disadvantages of the dependence of the spectral responsivity on the supply voltage, the difficult handling and the nonuniformity of the responsivity over the cathode area. Their advantage, however, is the high sensitivity as compared to all other methods.
With the biological-chemical detectors only a little number of the actinic and radiometric spectra can be realised with success. These detectors cannot display the momentary signal but only the dose over a certain exposure time. The linearity is limited. The greatest disadvantage is that these detectors need a certain evaluation time (e.g. film development time) after exposure until the user have the information on the UV-dose. No time structure of the UV-irradiation can be scanned. The advantage is the low price of such units, which allows one to make epidemic relevant measurements with suitable budget.
With the semiconductor detectors it is possible to measure the UV-irradiance and dose. The most semiconductor detectors are linear and relatively fast enabling the measurements of very short pulses (e.g. UV-laser pulses of ns-range). With suitable display units with logger-function, time structure of the radiation field can be scanned and graphically displayed. With the modern UV-CCD cameras of today, absolute cite-resolved UV-measurements can be performed. These detectors are between both former detection systems, as compared to the price and sensitivity. Some industrially used detectors are shown in Figure 1.
Figure 1. Spectral responsivities of some types of UV-detectors above 250 nm.
2. Problems of the applications
Since the PMT’s are not more common, only biological-chemical or semiconductor detectors are used. The biological-chemical detectors are used for the long-term healthy control for many people to get global data. As the units are only for dose measurements, especially for erythema dose, the field of applications is limited. Therefore, the most interest is in focussing on the semiconductor-based UV-meters.
The problems on the user side are the problems to be overcome by the manufacturers of the measuring equipment. Additionally, the meter developing engineers have the following problems:
The problems on the user side are:
3. States-of-the-art of the integral UV-meters
In the recent time, highly stable UV-meters for practically all well-known action spectra measuring up to 100 000 W m-2 and up to 200°C are available. Technical specifications of the UV-meters were described by the CIE Publication No. 53, and some drafts have been made in the frame of this UV-network. The state-of-the-art of the integral UV-meters is shown in Table 1.
Table 1. Properties of weighted-function radiometers for irradiance measurements, for which a numerical assessment is recommended.
|
Property |
Symbol |
State-of-art (1998) |
Spectral correction |
f 1’ |
10 % |
Short wave response |
u |
5 % |
Long wave response |
r |
5 % |
Cosine response |
f 2 |
2,5 % |
Linearity uncertainty |
f 3 |
0,2 % |
Uncertainty of display unit |
f 4 |
0,1 % |
Temperature coefficient |
a 25 |
± 0,2 % |
Fatigue |
f 5 |
0,2 % |
Modulated radiation |
f 7 |
0,1 % |
Polarisation |
f 8 |
- |
Range change |
f 11 |
0,1 % |
Inclination uncertainty |
f 12 |
0 % |
Non-uniform irradiation |
f 9 |
25 % |
Reference
[1] P. Knuschke, T. Q. Khanh, M. Brose, and H.-U. Heidrich, "Risikoanalyse für Arbeitsplätze mit Expositionen durch künstliche UV-Strahlenquellen," Strahlenschutzpraxis, September 1999, in press.
The Fourth Workshop in Borås,
September 6 - 8, 2000
The 4th Workshop of the Thematic Network for UV Measurements will be arranged at the SP Swedish National Testing & Research Institute, Borås, Sweden, on September 6 – 8, 2000. All participants are requested to register by sending the registration form (page *) to SP by June 30.
The programme for the workshop has not been fixed yet. The preliminary contents of the various days are presented below. The final programme will be sent later.
|
Wednesday, Sep 6 |
· Excursions to the laboratories of SP, starting around noon· Meeting of the network steering group (at 4 PM, for the steering group only) |
|
Thursday, Sep 7 |
· Short meetings of the working groups· Presentations on the final results of the working groups· Poster session· Workshop dinner |
|
Friday, Sep 8 |
· Presentations on the progress of EU-project "Improving the accuracy of ultraviolet radiation measurement"· Scientific presentations· Discussion on the continuation of the network |
The oral scientific presentations to be given on Friday will be selected by the network steering group. All participants of the workshop are encouraged to make poster presentations on their achievements in the field of UV measurement. To get a poster presentation, please send the title and an abstract on your preferred presentation to Petri Kärhä at HUT by June 30, 2000. The address may be found in the inside of the front cover.
There is also a possibility to exhibit equipment. If you wish to use this opportunity, please contact Britta Stålhammar or Leif Liedquist at SP.
The workshop takes place at the SP Swedish National Testing & Research Institute, Brinellgatan 4, Borås, Sweden, Building 1. SP is located about 2 km from the centre of Borås. Travel information: By air to Gothenburg Airport, Landvetter. Then take the Airport Bus to Borås (distance ~44 km). There is a Bus Stop both at SP and in the centre of Borås. SP will arrange a coach for transport between the hotel and SP.
50 rooms at the Hotel Borås, in downtown, have been preliminary booked. The participants should book rooms directly to the hotel with reference to UV-network and the reference number AZ089 in order to have a reduced price of SEK 788 per night, including breakfast.
Hotell Borås |
Tel.: +46 33 417020 |
The participants of the UV Network project (about 60 persons) are invited to attend the workshop without paying a participation fee. Accompanying persons and guests have to pay a workshop fee of SEK 600. This fee is paid with the registration at SP. The participation fee covers the costs of lunch on Thursday and Friday and the workshop dinner on Thursday.
The local arrangements of this workshop will be organised by the SP Swedish National Testing & Research Institute (SP Sveriges Provnings- och Forskningsinstitut):
|
SP Swedish National Testing & Research Institute |
Telephone: + 46 33 16 54 48 |
Fourth Workshop of the Thematic Network for Ultraviolet Measurements
SP Swedish National Testing & Research Institute
Borås, Sweden
September 6 – 8, 2000
Please mail, fax or e-mail the corresponding information by June 30, 2000 to
SP Swedish National Testing & Research Institute
Britta Stålhammar
Box 857
SE-50115 Borås, Sweden
Telefax: +46 33 165620
E-mail: britta.stalhammar@sp.se
Participant of the UV Network
¨Accompanying person
¨ (Participation Fee: SEK 600)Guest
¨ (Participation Fee: SEK 600)I wish to participate in laboratory excursion on September 6 afternoon
¨I wish to attend parallel session of Working Group (1+3) (2) (4) (circle)
Family name: ___________________________________ Title: ___________
First name(s): ____________________________________________________
Company: ____________________________________________________
Address: ____________________________________________________
_________________________________________________________________
Country: ____________________________________________________
Telephone: ____________________________________________________
Telefax: ____________________________________________________
E-mail: ____________________________________________________
Report on the First Training Course on Ultraviolet Measurement
The first training course on UV measurement was held at the National Physical Laboratory, Teddington, on September 6-7, 1999.
A total of 24 people applied to attend the Course, although two people were forced to cancel immediately prior to the date. This attendance was somewhat lower than anticipated. The reasons for this are not clear, although much wider publicity would certainly have helped. While NPL has great experience of publicising such courses within the UK, a much greater effort is required for publicity covering the whole of the EU. Nevertheless, information on the Course was in some cases disseminated very widely, as indicated by the attendance of four people from outside the EU, together with further expressions of interest from the USA.
It has been decided to hold the next run of the Course in Innsbruck on May 4-5, 2000. This will be basically a repeat of the first course, although some alterations in content would be beneficial, and these are suggested below.
The course consisted of a series of twelve lectures spread over two days, followed by a further half day of visits to relevant labs at the NPL. The broad content of the course had been determined to a considerable extent during discussions at the First Workshop of the EU Thematic Network in Helsinki in 1998, while the content of individual lectures was decided by each speaker, with guidance from NPL. The first lectures covered the basics of measurement: concepts, definitions, detectors, sources, materials, broad band and spectrally resolved measurements, the treatment of uncertainty in measurement, and traceability and quality assurance. There was then a series of lectures on particular application areas: Solar UV, Health, High power measurement, and finally a lecture on new developments. A shortcoming of the programme was that it was weighted rather heavily towards health and environmental applications, rather than industrial applications. This perhaps reflects the strong representation of these former applications in the Network as a whole, and future Courses should redress the balance. A particular omission was in the area of measurement of optical properties of materials (e.g. reflectance and transmittance). This can be remedied in part for the repeat run of the Course by a change in emphasis in the lecture on optical materials.
A further area for improvement is in co-ordination between the content of different lectures. Some lecturers were repeating what others had already said. This was maybe inevitable in the first run of such a Course, and the lecturers now have copies of the Course Notes, so that they will be better able to avoid covering the same material at the second run of the Course.
Otherwise, the Course was well received. Those attending returned Course Evaluation Forms to fill in, which indicated a consistently high level of satisfaction with the Course content, presentation, and organisation.
The Second Training Course on Ultraviolet Measurement
A Two-day Course on Ultraviolet (UV) Measurement
4-5 May 2000
Alpotel Tirol
Innsbruck, Austria
This Course is organised as part of the EU Thematic Network on UV measurement. The course will consist of twelve lectures (in English) on UV measurement theory and practice. It will be very similar to the course held at the National Physical Laboratory, UK, in September 1999. Extensive course notes will be provided to accompany the lectures.
The Course is aimed at technicians and scientists relatively new to the field, who are making UV measurements, or who need to use and understand such measurements (such as safety or quality assurance officers) regardless of their particular area of application.
The registration fee will be € 600, inclusive of Value Added Tax. This fee covers lunch on both days and evening meal on May 4th.
COURSE PROGRAMME
Monday, May 4
10:20 Opening remarks
10:30 Introduction: UV Measurement: Concepts and Definitions (Prof. O. Soares, University of Porto, Portugal)
11:30 UV Detectors (Dr. A. Sperling, OMTec GmbH, Germany)
12:30 Lunch
13:40 UV Sources (Drs. A. Bouman, Philips Lighting B.V., Netherlands)
14:40 UV Materials (Prof. W. Heering, University of Karlsruhe, Germany)
15:40 Break
16:00 UV Broad Band Measurement and Dosimetry (Dr. P. Rettberg, Institute of Aerospace Medicine, Germany)
17:00 UV Spectroradiometric Measurement (Dr. M. Blumthaler, University of Innsbruck, Austria)
18:00 Close
Tuesday, May 5
9:00 Treatment of Uncertainty in UV Measurement (Dr. Bill Hartree, National Physical Laboratory, UK)
10:00 High Power UV Measurement (Prof. W. Heering, University of Karlsruhe, Germany)
11:00 Break
11:20 Calibration Techniques And Traceability (K. Leszczynski, Centre for Radiation and Nuclear Safety, Finland)
12:20 Lunch
13:20 Measurement of Solar UV (Prof. M. Blumthaler, University of Innsbruck, Austria)
14:20 UV Measurements: Health and Biological Applications (Dr. P. Rettberg, Institute of Aerospace Medicine, Germany)
15:20 New Developments in UV measurement (Dr. N. Harrison, National Physical Laboratory, UK)
16:20-16:30 Closing remarks
General Information
Location
Flights to Innsbruck are available from a number of European cities. There are also good rail connections with the rest of Europe. The Alpotel is located in the centre of Innsbruck, about 500 m from the main railway station, and 10 minutes by bus from Innsbruck airport. A city map is available at http://www.mapquest.com (click on "online maps"). Alternatively, contact Bill Hartree at the address given below.
Accommodation
A block booking of rooms, each with en suite toilet and bathroom, has been made at the Alpotel, a 4 star hotel, price €59:00 per night, including breakfast. Numbers are limited, so you should book early. A further booking has been made at the nearby Hotel Maximillian at €69:00 per night Alternative accommodation is available at many other hotels nearby. To reserve rooms you must contact the hotel directly. Information on the Alpotel and other hotels is available at http://www3.tiscover.com/ibk/innsbruck/hotelibk.html. Alternatively information can be obtained from Bill Hartree, at the address given below.
Payment of the Course fee
Payment, in €, is to be made as soon as possible after returning the registration form, and can be by:
If you require an invoice before making payment you must first send a purchase order to NPL.
Deadline
Registration forms should be returned by 20th April 2000.
Further information
Please contact Bill Hartree
Tel: + 44 20 8943 6416
Fax: + 44 20 8943 6935
E-mail: bill.hartree@npl.co.uk
Registration form:
Two-day Course in UV Measurement
4-5 May 2000
(Please return to Bill Hartree, address given below)
Name………………………………………………………..Job title ……………………
Organisation………………………………………………………………………………
Address……………………………………………………………………………………
……………………………………………………………………………………………
Telephone:…………………………….. fax:……………………………..
e-mail:…………………………………….
¨
I will attend the coursePLEASE SEND COMPLETED FORMS TO:
Bill Hartree
Centre for Optical and Environmental Metrology
National Physical Laboratory
Teddington, Middx
U.K.
TW11 0LW
The success of the project was evaluated with a questionnaire distributed to all participants of Training Course 1 and Workshop 3. A total of 49 questionnaires were filled in and returned. Questions were asked on both the importance and the quality of the actions arranged by the Network. A summary of the replies is given in the table below. The rating goes from 1 (poor) to 5 (excellent). Based on the results, it may be concluded that the project can be considered a success. The actions are considered both important and well organised.
The basic need for the evaluation was to decide whether the Network should continue through year 2000. Based on the results, need for this continuation seems obvious. One interesting point is that participants consider it very important to continue the operation of the Network also after year 2000. There is no EU funding available for continuation. Finding a suitable way to continue will certainly be one key issue in the Workshop 4 in Borås.
|
Importance of actions |
||
|
Action |
Average |
Standard deviation |
|
Workshops |
4,5 |
0,6 |
|
Oral presentations |
3,8 |
0,9 |
|
Poster presentations |
3,4 |
0,8 |
|
Equipment exhibitions |
3,3 |
0,8 |
|
Working groups |
4,4 |
0,7 |
|
Training course |
3,9 |
0,9 |
|
Newsletter |
4,1 |
0,8 |
|
WWW-Pages |
4,2 |
0,7 |
|
Project as whole |
4,1 |
0,7 |
|
Continuation of the Network after year 2000 |
4,1 |
0,9 |
|
Average |
4,0 |
0,8 |
|
Quality of actions |
||
|
Action |
Average |
Standard deviation |
|
Workshop 1 |
3,8 |
0,9 |
|
Workshop 2 (Braunschweig) |
3,8 |
0,7 |
|
Workshop 3 (Teddington) |
3,8 |
0,8 |
|
Working groups |
||
|
WG 1 |
4,2 |
0,8 |
|
WG 2 |
3,5 |
0,8 |
|
WG 3 |
3,8 |
0,8 |
|
WG 4 |
4,0 |
0,8 |
|
Training course |
3,9 |
0,7 |
|
Content |
3,8 |
0,7 |
|
Administration |
4,0 |
0,6 |
|
Oral presentations |
3,9 |
0,6 |
|
Course notes |
3,8 |
0,9 |
|
Newsletter |
4,1 |
0,7 |
|
Contents |
3,9 |
0,6 |
|
Appearance |
4,0 |
0,7 |
|
WWW-Pages |
4,1 |
0,7 |
|
Contents |
3,9 |
0,7 |
|
Appearance |
4,1 |
0,7 |
|
Co-ordination |
4,1 |
0,7 |
|
Average |
3,9 |
0,7 |
The Network has four working groups, each working on a selected key issue in UV measurements. The working groups are operating mainly by exchanging E-mail. If you wish to be informed about their activities, please contact the corresponding working group leader. You may also use the service card at the end of this UVNEWS.
Working group 1: Guidance for UV power meter classification for particular applications
Gigahertz-Optik
Director Anton Gugg-Helminger
Fischerstraße 4
D-82178 Puchheim, Germany
(
+49-89-89015920Working group 2: Improvement of measurement and calibration methods for spectrally resolved UV measurements
Physikalisch-Technische Bundesanstalt
Department 4.1 Light and Radiation
Prof. Dr. Jürgen Metzdorf
Bundesallee 100
D-38116 Braunschweig, Germany
(
+49-531-5924100
Working group 3: Improvement of measurement and calibration methods for spectrally weighted UV measurements
NPL Management LTD
National Physical Laboratory
Dr. Nigel Fox
Queens Road, Teddington
Middlesex, TW11 OLW, United Kingdom
(
+44-181-9436825Working group 4: UV Measurements related to health and safety
University of Dundee
The Photobiology Unit
Dr. Harry Moseley
Ninewells Hospital & Medical School
DDI 9S4, United Kingdom
(
+44-1382-632240 / +44-1382-633894More information, including the latest annual reports, can be found at the Internet pages of the working groups
(http://metrology.hut.fi/uvnet/groups.html).
If you would like to add some material to the web pages of your working group, please consult the corresponding working group leader.
Announcement of Opportunity
7th Call for Proposals to the
Large Scale Facility
for Arctic Environmental Research
(Ny-Ålesund LSF)
Ny-Ålesund, Svalbard, Norway
Deadlines: March 4, 2000 and September 1, 2000
Under the "Access to Research Infrastructures" activity of the "Human Research Potential" programme of the European Community, access will be provided for new European researchers to the Ny-Ålesund International Arctic Environmental Research and Monitoring Facility in Ny-Ålesund, Svalbard, Norway. Interested European research groups and scientists are invited to submit scientific research proposals on Arctic environmental research within the following disciplines:
Access is offered under this programme for research groups and citizens from Member States and Associated States of the European Union. Subject to a scientific evaluation procedure, the selected projects are offered reimbursement of all travel and subsistence costs (only) for their project campaigns in Ny-Ålesund. Access is available to the following research installations:
For further information about the Ny-Ålesund LSF, terms of access and funding, eligibility criteria, deadlines and application forms, current research programs and possible new projects, please visit our Ny-Ålesund LSF WWW home page given below or contact the LSF-secretariat.
Scientific project proposals, including a list of relevant publications and experience of the researcher (CV), should be submitted by March 4, 2000 (first round) or September 1, 2000 (second round) to the LSF secretariat.
Further information:
|
Ny-Ålesund LSF Secretariat |
Telefax: + 47 79 02 26 04 http://www.npolar.no/nyaa-lsf/ |
Second edition of the Brochure for European Optical Radiation Calibration Services
The second edition of the Brochure for European Optical Radiation Calibration Services has been completed in November 1999. This brochure describes calibration services offered in the field of optical radiation measurement by national and accredited laboratories throughout the EU. The brochure aims to enable the reader, in industry and elsewhere, to easily obtain information on the calibration services which are available in optical radiation throughout Europe. The second edition has calibration service entries from a further five European countries, making it much more comprehensive than the first.
The two editions of the brochure have been developed within project SMT4-CT96-6511, funded under the Standards, Measurement and Testing (SM&T) research and development programme, Directorate General XII, Commission of the European Communities. The project has been co-ordinated by NPL, UK.
Copies of the Brochure may be obtained from national standards laboratories or directly from NPL.
Further information:
|
Dr. Julie Taylor |
Telephone: + 44 20 8943 6539 |
NPL Optical Radiation Measurement Club
Medical Focused Interest Group Meeting
Dosimetry
A J Coleman (Guy’s & St Thomas’ Hospital)
The Photobiology Unit, University of Dundee, 18th January 2000
This meeting was organised by the National Physical Laboratory (NPL) and was the second meeting of the newly formed Medical Focused Interest Group (Medical FIG) which is part of the NPL Optical Radiation Measurement (ORM) Club. The meeting considered dosimetry issues in phototherapy including, in particular, ultraviolet (UV) treatment cabins. The Photobiology Unit at Ninewells Hospital in Dundee hosted the gathering that was attended by an encouragingly large number of delegates (25) including ORM members and non-members. The informal colloquium style of the meeting provided scope for some lively discussion on a topical subject. The unseasonably good weather in Dundee and the warm welcome received made up for the generally rather complex travel arrangements for many of the delegates.
Dosimetry in phototherapy
The delegates were welcomed by Professor Ferguson (Dundee). In his introductory remarks he highlighted the increasing importance of accurate dosimetry in phototherapy. Some particular dosimetry problems, with up to 100% dose differences between centres, have been noted since narrowband UVB phototherapy using Philips TL01 fluorescent tubes have been introduced in many centres to replace the traditional PUVA treatments.
Dr A Coleman (London). Summarised the role of the Medical FIG. The first meeting in July 1999 was attended by about 20 delegates and agreed to consider measurement issues associated with UV dosimetry in phototherapy treatment cabins. Accurate dosimetry in phototherapy is required principally to ensure that:-
The three main tasks associated with dosimetry that were undertaken at the July ‘99 meeting included:-
These issues formed the agenda for the current meeting and some talks followed by discussion were used to assess the consensus on how to advance these tasks. The last item, the need for a database of spectral output of phototherapy units, is related to the current tube labelling confusion. It was agreed that these would be collected by Andy Coleman who would welcome any measured spectra from specified sources including whole body treatment cabins. It is intended to make this widely available.
Dr J Lloyd (Newcastle) reported on a very interesting preliminary survey of four UV meter calibration centres that he has undertaken with the support of Able Instruments & Controls Ltd. An IL1400A UVA and TL01 (narrow band UVB) meter was sent to each centre. Staff were asked to calibrate it as they would any customer’s meter. The ratio of the maximum and minimum meter calibration factor provided by these centres was 1.25 for the case of UVA and 1.6 for the TL01 meter. The results were taken to suggest that there is need for further work towards achieving greater consistency between centres. Dr Lloyd also indicated that this survey would continue and would encompass other centres and that the results would be made available to the centres involved.
Mr R Lambe (NPL) led discussion on the UK survey of calibration centres planned by the Medical FIG. It was decided that, whilst a meter based survey helped to identify the size of variations between centres, it would also be useful to send around a lamp in an attempt to establish where the observed variability originates. The imposition of a more defined measurement protocol in addition to the techniques normally used in a centre would also assist in identifying causes of discrepancies and help to spread best practice. Such a lamp based survey would be expected to show, for example, if significant variability was being introduced by errors associated with the techniques used. There was broad agreement to proceed with this approach and any centre interested in taking part should contact Mr Lambe (NPL) or Dr Coleman (St Thomas’ Hospital). It was noted that the costs associated with such a survey would make it difficult for centres to take part. NPL will investigate sources of funding to assist centres.
Dr S Pye (Ebinburgh) presented an extremely comprehensive set of data on the directional response of 22 commonly used radiometer/diffuser combinations. The meters were produced by seven different manufacturers (Glen Spectra, International Light, Macam Photometrics, Micropulse, Solatell, UVP, Waldmann) and all were designed for measurement of radiation in the UVB or UVB+UVC regions. The conclusions from the mass of data acquired was that, in narrowband UVB phototherapy, the observed errors in directional response characteristics can easily lead to differences of 10-30% in measurements of irradiance made in phototherapy cabins. It was recommended that radiometer used for UVB and actinic measurements should have ‘f2’ errors (CIE 69) of less than 10%. In simple terms, this means that a meter must have an adequate diffuser. This is by no means the case in many of the meters used in phototherapy centres in the UK.
Mr R Lambe (NPL) led discussion on the Medical FIG draft dosimetry guidelines. There was a broad consensus that such guidelines were necessary both for phototherapy cabin operators and for the physics and technical staff involved in checking the equipment. It was pointed out that CIE committee was looking at the issue of UV irradiance meter specification. The Medical FIG guidelines would not conflict with or duplicate these if written as a ‘best practice guide’. A draft of this guide would be circulated to those present before the next Medical FIG meeting in June or July. It was noted that the British Photodermatology Group (BPG) was also preparing recommendations on UV dosimetry. These have been circulated and are of a more general and clinical nature. In keeping with the role of the Optical Radiation Measurement Club the best practice guidelines produced by the Medical FIG would specifically concentrate on the measurement issues, traceability, accuracy and reproducibility.
Dr D Taylor (Gloucestershire) reported on his visit to the factory of one of the largest suppliers to the NHS of phototherapy treatment cabins (Waldmann GmbH in Germany) which was made at the invitation of Athrodax Medical Ltd, the UK agent. Along with Dr Moseley, he was shown the UV meter calibration approach used by Waldmann. This involved intercomparison of a test and reference meter which were mounted at a fixed distance in a specially designed source consisting of a few short fluorescent tubes contained in a black plastic box. There was no information provided on how the reference meter was calibrated. Dr Taylor noted that the source being used for calibration was unrepresentative of the large sources used for clinical treatments and it seemed quite likely that the calibration would contain significant errors as a result of these differences. Investigation is continuing but a solution to the current problem of how to bring currently used Waldmann cabins into calibration was examined by Dr Taylor, who described how the in-built meter of a Waldmann cabin could be adjusted, although with a warning that one would have to be very sure of the calibration before undertaking such adjustments.
Dr H Moseley (Dundee) was suffering from flu and his talk on the revised Scottish UV Phototherapy Guidelines was given by Steve Pye (Edinburgh).
The Scottish PUVA Dosimetry guidelines were produced in 1995. This followed an audit of PUVA treatment centres in Scotland. Although the main thrust of the audit was clinical, it was demonstrated that dosimetry was non-uniform and significant discrepancies 960%) existed in terms of measured UV dose. It was recommended that ‘the current metering situation in Scotland should be reviewed and standardised’. The Scottish PUVA Dosimetry Guidelines were drawn up to address this issue. It dealt with both the use of the meter as well as its calibration. It was not a prescriptive document. It did not take a ‘recipe book’ approach, but recognised the importance of understanding the measurement being carried out. A new audit has recently been completed looking at Phototherapy and Photochemotherapy in Scotland. This has shown that there is now good agreement in dosimetry among Scottish PUVA centres (20%) but there are significant discrepancies (100%) in narrowband (TL01) UVB dosimetry. One of the main features of the revised guidelines is the inclusion of TL01 treatment units. It is important to ensure comparable methods in TL01 dosimetry as the number of such units is increasing whereas there are now fewer PUVA cabins in use in Scotland.
Mr D Burnham (Able Instruments, Reading) gave a manufacturers viewpoint of some of the dosimetry problems being discussed. Mr Burnham noted that, whilst meter suppliers can provide a wide range of detectors with different filter/diffuser combinations to match measurement requirements over UVA, UVB and UVC regions of the UV in almost all medical applications, a problem arises when users cannot determine their ‘terms of reference’ for the measurement. The users, be they Medical Physicists, Research Clinicians, Dermatologists or Physicians, must define the quantity they wish to measure since it is apparent to the suppliers that such definitions or ‘terms of reference’ are not consistent throughout the country. Specifically, this refers to the problem under discussion at the meeting concerning variations between calibration centres resulting from differences in calibration protocol and definitions of relevant wavelength ranges. Mr Burnham indicated that he hoped that meetings such as this will help resolve the manufacturer’s dilemma.
To summarise, the meeting attacked the current problems in phototherapy dosimetry from several angles; the meter specification, the meter calibration and the measurement protocol. The high attendance showed that there was a wide interest in UV dosimetry. Dundee proved to be a good place for a meeting with beautiful scenery, views of the Tay bridge and a chance to see ‘Discovery’, the ship that took Captain Scott to the Antarctic, which is moored in the quay next to an excellent eating house and pub. Thanks are due to Fiona Jones (NPL) for organising the meeting.
Further information:
|
Dr. Andrew J. Coleman |
Telephone: + 44 - 207 - 922 - 8072 |
IFA-CSIC NEWS
A facility has been developed in the Instituto de Fisica Aplicada (IFA_CSIC) of Spain to perform a variety of detector characterisations in the air UV from 230 nm to 400 nm. The facility allows the measurement of spatial uniformity, linearity and the spectral responsivity of different detectors, irradiated by a He-Cd laser or by a monochromator and a Xe discharge lamp. With this technique a set of Si photodiodes, Si detectors in trap configuration, and UV radiometers, built with SiC detectors in an integrating sphere, have been calibrated and their absolute responsivity at the He-Cd laser UV line has been determined with respect to an absolute cryogenic radiometer.
Further information:
|
Dr. Antonio Corrons Rodríguez |
Telephone: + 34 - 1 - 5618806 |
NEWRAD 99
The seventh international conference on New Developments and Applications in Optical Radiometry (NEWRAD99) took place in Madrid, Spain, in October 25-27 of 1999.
The conference program included
In this conference, 139 papers in oral and poster format were presented. There were over 150 specialists interested in the accurate measurement of optical radiation, including those working in NMI’s, Space Applications, Remote Sensing and Solar Measurements, who attended the Conference.
There were an important number of papers dealing with UV Radiometry.
A selection of about 70 papers presented at NEWRAD99 will be published in a special issue of "Metrologia".
Further information:
|
Dr. Antonio Corrons Rodríguez |
Telephone: + 34 - 1 - 5618806 |
CEN/TC 248 WG 14 - UV protective properties of clothing
In the first issue of this newsletter we reported on the activities of the working group CEN/TC 248 WG 14 on the UV protective properties of textile materials. This group has reached a consensus on a measurement technique to determine the UPF (Ultraviolet Protection Factor) of textile materials. The reproducibility and repeatability of this method has been evaluated in a Round Robin with 8 laboratories. The draft standard has now been published for ‘Public Enquiry’ under the reference prEN 13758 "Textiles - Solar UV protective properties - Method of test for apparel fabrics."
The working group has also started discussion on the marking and labelling of UV protective clothing. It is estimated that a consensus will be reached on a proposal for a new CEN standard entitled "Textiles - Solar UV protective properties - Classification and marking of apparel" within the second half of this year.
Further information:
|
Jan Laperre |
Telephone: + 32 - 9 - 2204151 |
THE AUTH/COST/WMO INTERCOMPARISON CAMPAIGN OF ERYTHEMAL RADIOMETERS
An intercomparison campaign with a concurrent laboratory characterisation of erythemal radiometers was co-organised by the Laboratory of Atmospheric Physics (LAP) of the University of Thessaloniki, the World Meteorological Organization and the COST project of the EC, in Thessaloniki, Greece, from 13 to 23 September 1999. Twenty-nine instruments from 14 countries took part in the campaign, representing the most widely used instrument types (SL-501, YES UVB-1, Kipp & Zonen CUV3, Scintec, Vital BW 100, EKO MS-210D and MO-MSU). The measurements of these radiometers were compared with collocated spectral measurements obtained by a Bentham DTM300 spectroradiometer belonging to the Institute of Medical Physics of the University of Innsbruck, and a Brewer Mk III spectroradiometer operating by the local host Institute (LAP).
The objective of the campaign was to verify the absolute calibration of the broadband detectors with respect to integrated irradiances derived by the spectroradiometric measurements, as well as to determine their spectral and angular responses in the laboratory. The calibration factors for all instruments were determined by direct comparison to CIE-weighted global irradiance spectra as a function of solar zenith angle. In addition the radiometric calibration of the radiometers was established by comparison to the spectral measurements weighted with the spectral response of each radiometer.
For the intercomparison campaign the detectors were arranged side by side on a platform of 4m long and 60 cm wide, ensuring similar exposure to solar radiation. The measurements of the detectors were recorded at one-minute intervals, while the spectroradiometers sampled one spectrum of global irradiance at 20-minute intervals, continuously from sunrise to sunset, covering a range of solar zenith angles between 90° and 48°. According to schedule, the outdoors measurements lasted for three full days, though only one was completely cloud free.
The laboratory characterisation of the radiometers was done at the newly developed facility at LAP, which comprises a powerful light source (Xe 1000W arc lamp), a SPEX 1680 double monochromator, and a calibrated photodiode, which is used as reference. To account for short-term fluctuation sin the output of the Xenon lamp, the quasi-monochromatic beam was divided into two parts, enabling simultaneous sampling of the radiometer and the photodiode at each wavelength. The spectral response (that was derived from the ratio of these two measurements) was measured twice for each instrument, first using 4 nm wide slits throughout the entire spectral range, and second using different combinations of slits to optimise the signal to noise ratio. Finally, the angular response was measured at the wavelength with the radiometer’s maximum sensitivity at one plane, 90° either side of the normal incidence of the output beam.
From the comparisons of broadband with the spectroradiometric measurements, new calibration factors were derived for each instrument. The differences with the calibration factors that each instrument used before the campaign ranged from -10% and +25%. For about half of the instruments these differences were smaller than about 10%, whereas only a few of them succeeded to agree with the spectroradiometer to better than 5%. These deviations depend very much on the time elapsed between the two subsequent calibration checks, but also on the individual characteristics of each instrument. The large deviations found for many of the instruments suggest that the calibration of broadband detectors should generally be checked more frequently, either in comparison to a spectroradiometer, or at least against another instrument of similar type.
In general, the measured spectral responses at wavelengths below about 330 nm agreed quite satisfactorily with the ones supplied by the manufacturers of the instruments. At higher wavelengths, however, significant deviations were observed, the causes for which are so far irresolvable. Further investigation is undergoing aiming in delineating this issue.
The results of this campaign will appear in a report, which will be published by WMO in its Global Atmosphere Watch series, and is expected to be available by the end of spring 2000.
Further information:
|
Alkis Bais |
Telephone: + 30 - 31 - 998184 |
Spectral Calibration Service for UV-Meters
Broadband instruments used in UV monitoring should be calibrated periodically to achieve comparable data of the UV-index [1]. The spectral response functions (Figure 1) of UVB Meters deviate from each other and change also in a relative small time scale [2].
Figure1. Erythema action spectrum and spectral response functions of an UVB-Meter. Time between calibrations is 19 months.
The company ‘Calibration Measurement Softwaresolutions – Mag. Ing. Schreder’ offers the capability of calibrating detectors.
Accurate absolute calibration services are achieved by using PTB (Physikalisch Technische Bundesanstalt, Braunschweig, Germany) traceable standards and high quality double monochromators from BENTHAM. Beside the relative spectral response, a lookup table is provided which contains the calibration factors in dependence on solar elevation and ozone content.
For example, annual calibrations of the broadband detectors from the Austrian UV-B-Monitoring Network [3] are carried out in the calibration laboratory (UV-Biometers from SOLAR LIGHT CO.). It is advisable to calibrate such monitoring instruments even on a shorter time scale, because faulty meters not only affect scientific investigations but also can endanger human health.
The company collaborates closely with other international institutes performing similar measurements.
Angular Response Measurement Service
The company ‘Calibration Measurement Softwaresolutions – Mag. Ing. Schreder’ has a computer controlled, stepping motor driven cosine-measurement facility. This allows determining the angular response of a detector with high angular accuracy. With this setup, errors due to misalignment are below 2 % at 85°. Routine measurements in the planes south-north and east-west are carried out.
References:
[1] WMO Report Nr.25: Report of WMO meeting of experts on UV-B measurements, data quality and standardization of UV-indeces, Les Diablerets, Switzerland, July 1994.
[2] Silbernagl R. and Blumthaler M.: "First Experiences with the Austrian UV-Monitoring Network," European Conference on Atmospheric UV Radiation, Finland, July 1998.
[3] Federal Ministry of Environment: Monitoring of Total Ozone and UVB-Radiation in Austria, ISBN 3 901-271-94-5, February 1999.
Further information:
|
Calibration · Measurement Softwaresolutions |
Telephone: + +43 - 512-5073567 |
Summer School on "Recent Advances in Metrology and Fundamental Constants"
We are pleased to announce that the program of the "Enrico Fermi" Summer School on "Recent Advances in Metrology and Fundamental Constants" to be held in Varenna, Italy, on July 25 - Aug 4, 2000 is now finalised. We invite you to explore
http://www.ien.it/users/varenna/
http://www.sif.it/sif/sif/varenna/2000-course-3.html
for further details. You are kindly requested to diffuse this message and to encourage possible applicants. We are also pleased to announce that we are negotiating a possible number of scholarships that could give financial support to deserving students, particularly from EU or Associated Countries. The application form and instruction for scholarship solicitation can be found in the above web pages.
For this course we have planned the possibility for students to present their activity through a poster. The interested student should add an abstract of the proposed poster together with the application form. The posters will be selected by the School Directors on the basis of the general interest of the proposed topics and of the available room
Looking forward to meeting your students in Varenna!
Further information:
|
Patrizia Tavella |
Telephone: + 39 - 011 - 3919235 |
Announcement for 1st training course of the DAfP
(language will be German)
Light and Plant
Topics:
Fundamental light and UV-radiation mechanisms in photosynthesis, photomorphogenesis, growth, secondary metabolism, yield in terrestrial and aquatic organisms. Irradiation designs for plant nursery.
6. and 7. October 2000,
University of Erlangen, Faculty of Natural Sciences II
|
|
DAfP German Academy for Photobiology and Phototechnology e.V. |
|
Association for technical and medical application of optical radiation |
|
Further information:
|
Prof. Dr. D.-P. Häder |
Telephone: + 49 - 9131 / 85-28216 |
Registration:
|
Geschäftsstelle der DafP |
Telephone: + 49 - 3677 / 202-934, -935 |
Portable Measurement of UV Hazard Radiation
ABLE Instruments & Controls Ltd have designed a handheld radiometer that correctly and accurately measures all types of UVA, UVB, and UVC lamps to detect leakage, which may put employees at risk. The system conforms to OSHA and ACGIH requirements for occupational exposure.
ABLE’s IL1430 Health Hazard Radiometer is a hand-held instrument that performs field measurements of UV, blue and infrared radiation to detect leakage which can be dangerous to employees and patrons. Self-programmable and easy to operate, it features a solar blind detector and a new thin-film filter which precisely matches the UVA, UVB and UVC action spectra.
Totally rejecting out of band radiation to less than 1 part in 10 000, ABLE’s ILI430 Health Hazard Radiometer provides readings instantly in mJ/cm2 to J/cm2 or in m W/cm2 to mW/cm2 on an LCD. The ILI430 can also integrate doses at each wavelength to obtain the average dose/hour and total doses/day. Powered by 4 AA batteries, it stores calibration history and previous zero conditions in memory.
Pricing for ILI430 or any of ABLE’s range of radiometers, photometers and spectroradiometers is available by contacting ABLE directly.
Further information:
|
ABLE Instruments & Controis Ltd |
Telephone: + 44 (0) 118 931 1188 http://www.able.co.uk/ |
X20002 - UV Monitoring Dosimeter with ICNIRP and UV-A Response Functions for Individual Exposure Measurement
When the time spent over a period in an irradiated area is changeable and unpredictable, the individual exposure must be determined by personal UV monitoring. In the context of radiation protection, it is recommended that sample measuring cycles using personal UV dose meters are carried out for this purpose. Gigahertz-Optik have developed the X20002 personal UV dosimeter for this application. This mobile device has a data logger with a large storage capacity that can record the signals from the integrated ICNIRP and UV-A detectors over long periods with high sampling rates. The device is adjusted and the data is read out via the RS-232 interface. The current-saving electronics with their "Sleep-Mode" guarantee a long life for the 1.5V battery. The device can be fixed to clothing using the clip on the housing.
Special features:
Artificial sources of radiation that emit ultraviolet radiation represent a potential exposure risk in working places where they are used, since this radiation dose is additional to the daily dose received from natural solar radiation.
The evaluation of this additional UV radiation exposure is made according to two independent criteria, for which there are recommended limits:
Two basic measuring procedures may be considered for measurement of these two magnitudes:
The second group includes the X20002 UV Monitoring Dosimeter from Gigahertz-Optik. The integral procedure is preferred when the spectral characteristics of the radiation field are known. In this case the uncertainty of measurement, considered actinically, of these compact and mobile devices is adequate. This statement, however, only applies to precision instruments that satisfy a number of requirements:
Gigahertz-Optik GmbH manufacture UV power and dosage measuring instruments that satisfy these demanding requirements. The most important conditions for the high quality of these devices are the careful implementation of the spectral sensitivity, checked by computer simulation, the use of carefully selected optical, opto-electronic and electronic components, and the calibration in our Calibration Laboratory for Optical Radiation Quantities. Our laboratory is accredited for the Quantities of spectral sensitivity and spectral irradiance as a DKD (German Calibration Service) calibration laboratory according to DIN EN 45001 (Reg. No. DKD-K-10601). Our certificates are therefore recognised across Europe through the WECC (Western European Calibration Cooperation).
The X20002 UV monitoring dosimeter has also been designed in accordance with these criteria mainly for use in sampling investigations related to personal dosimetry. The important guidelines followed in the development of this novel device were:
The X20002 entirely satisfies these requirements, and yet offers a favourable price/performance ratio, in particular when its repeated use is contrasted with UV-sensitive films.
The device is as easy to handle as could be wished. It has a single RS232 interface, and this can be connected to a PC or laptop with the RS232 adapter cable that is included. The supplied software allows versatile adjustment of the measuring parameters. Once a series of measurements has been concluded, the data (ICNIRP and UV-A irradiance, operating temperature) can be read as a function of time, and saved under a freely selectable filename. We recommend standard programmes such as EXCEL for the evaluation and display of the measurement series.
Further information:
|
Gigahertz-Optik GmbH |
Telephone: + 49-89-8901590 http://www.gigahertz-optik.com/ |
Receiver: Helsinki University of Technology
Petri Kärhä
Telefax: +358 - 9 - 451 2222
¨
Remove me from your mailing lists and do not send me material related to the Thematic Network for Ultraviolet Measurements anymore.¨
Add me to your mailing lists and send me material related to the Thematic Network for Ultraviolet Measurements in the future.¨
I would be interested to join the Working group Nr. 1 2 3 4 (circle)¨
Update my contact information¨
Sender:
Company:
Departement / Lab.:
Name:
Title (circle): Prof. Dr. Mr. Mrs. Ms. Other:
Address:
Country:
Telephone:
Telefax:
E-mail: